Unlock a Comprehensive View of Your Program's Impact
Visualize client progress, track key metrics, and make informed decisions with our powerful executive dashboard.
Turn Your Data Into Actionable Insights
Make data-driven decisions with confidence. Our comprehensive analytics and reporting capabilities help you track outcomes, secure funding, and demonstrate measurable impact to stakeholders.
Automated Reporting
Generate comprehensive executive reports automatically. Perfect for board meetings, grant applications, and compliance requirements delivered on your schedule.
Seamless Data Integration
Connect with existing systems effortlessly. Our flexible data egress and ingress capabilities maintain consistency across all your platforms.
Custom Metrics
Track what matters to your organization. Define custom metrics, demographic tracking, and outcome measurements tailored to your grant requirements.
Ready to unlock powerful insights from your data?
A Bird's-Eye View of Your Entire Operation
Track the metrics that matter most to your organization, from high-level trends to individual client progress. Our executive dashboard brings all your data together in one intuitive interface.
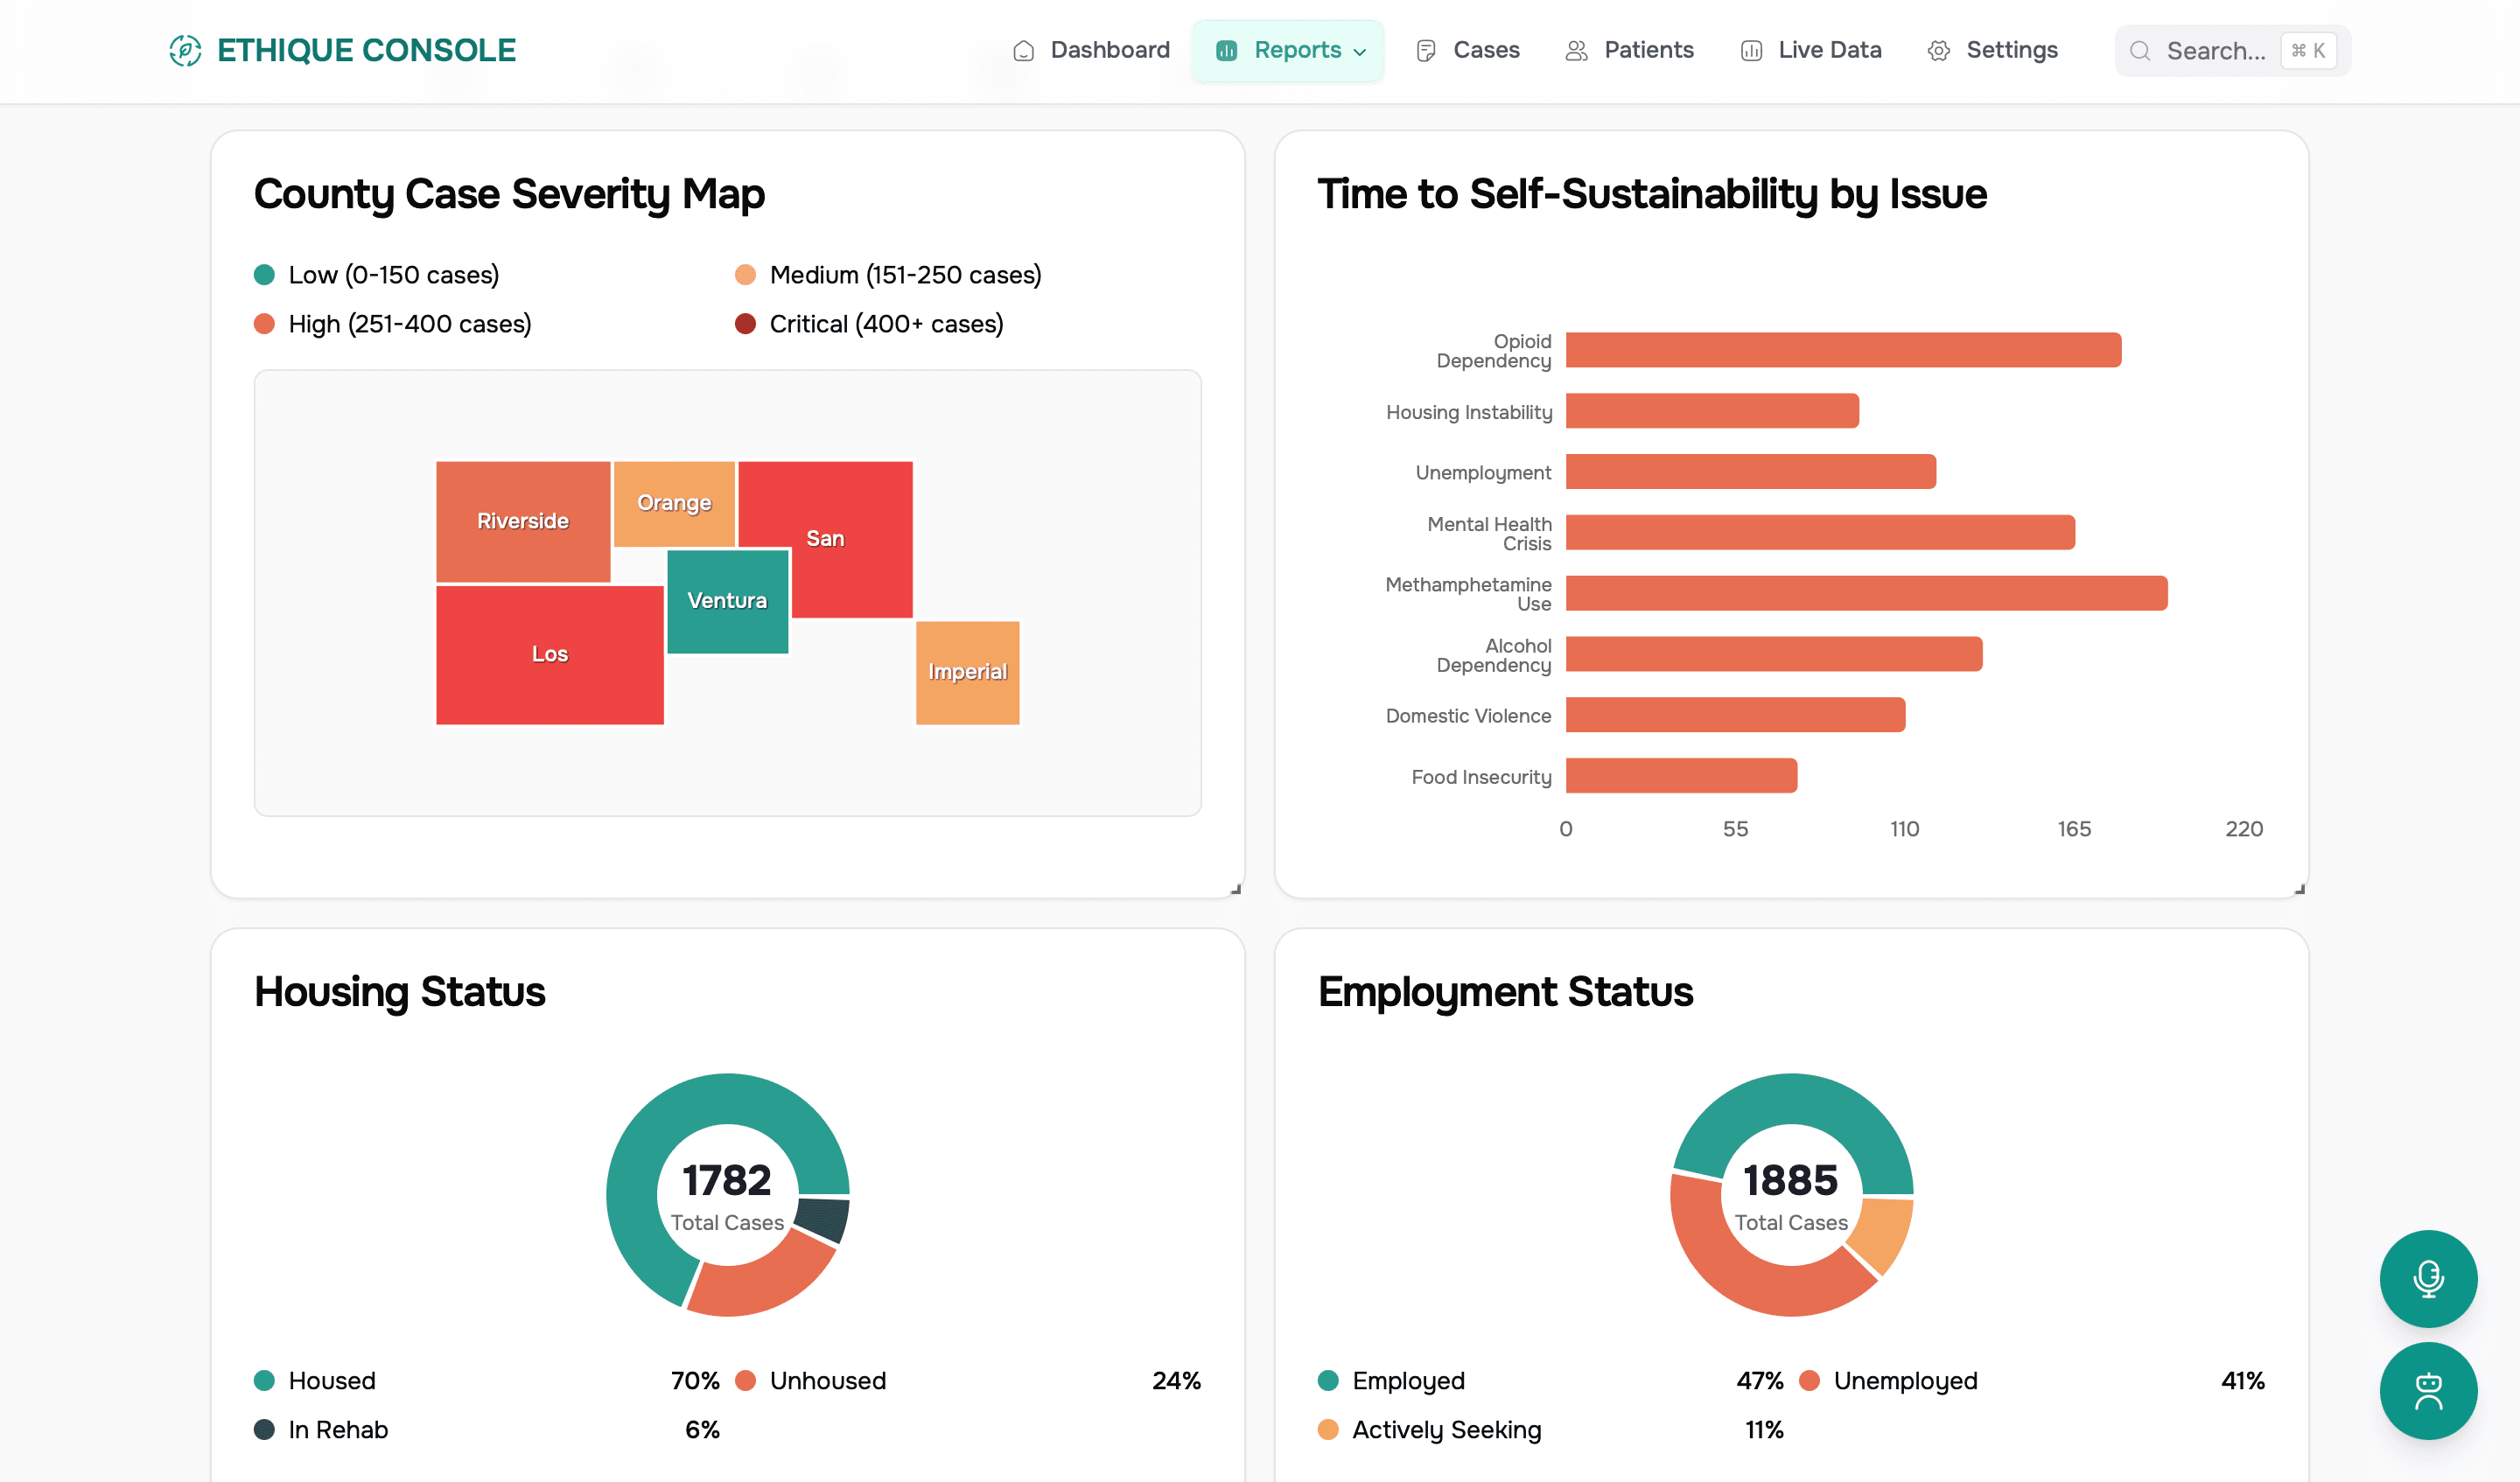
Track Housing Outcomes at a Glance
Monitor housing stability across your entire client population. See real-time breakdowns of housed clients, those in rehabilitation facilities, and individuals experiencing homelessness.
Housing Status Distribution
1,247
Total Cases
Identify Substance Use Patterns
Understand the scope and nature of substance use disorders in your client population. Track trends in opioid, methamphetamine, alcohol, and other substance use to inform treatment approaches and resource allocation.
Substance Usage Distribution
Track Real-World Impact Over Time
Monitor how client outcomes have evolved throughout the year. See trends in successful housing placements, employment gains, and benefit enrollments to demonstrate your program's growing impact.
Client Outcomes by Quarter (2024)
+42%
Year Growth
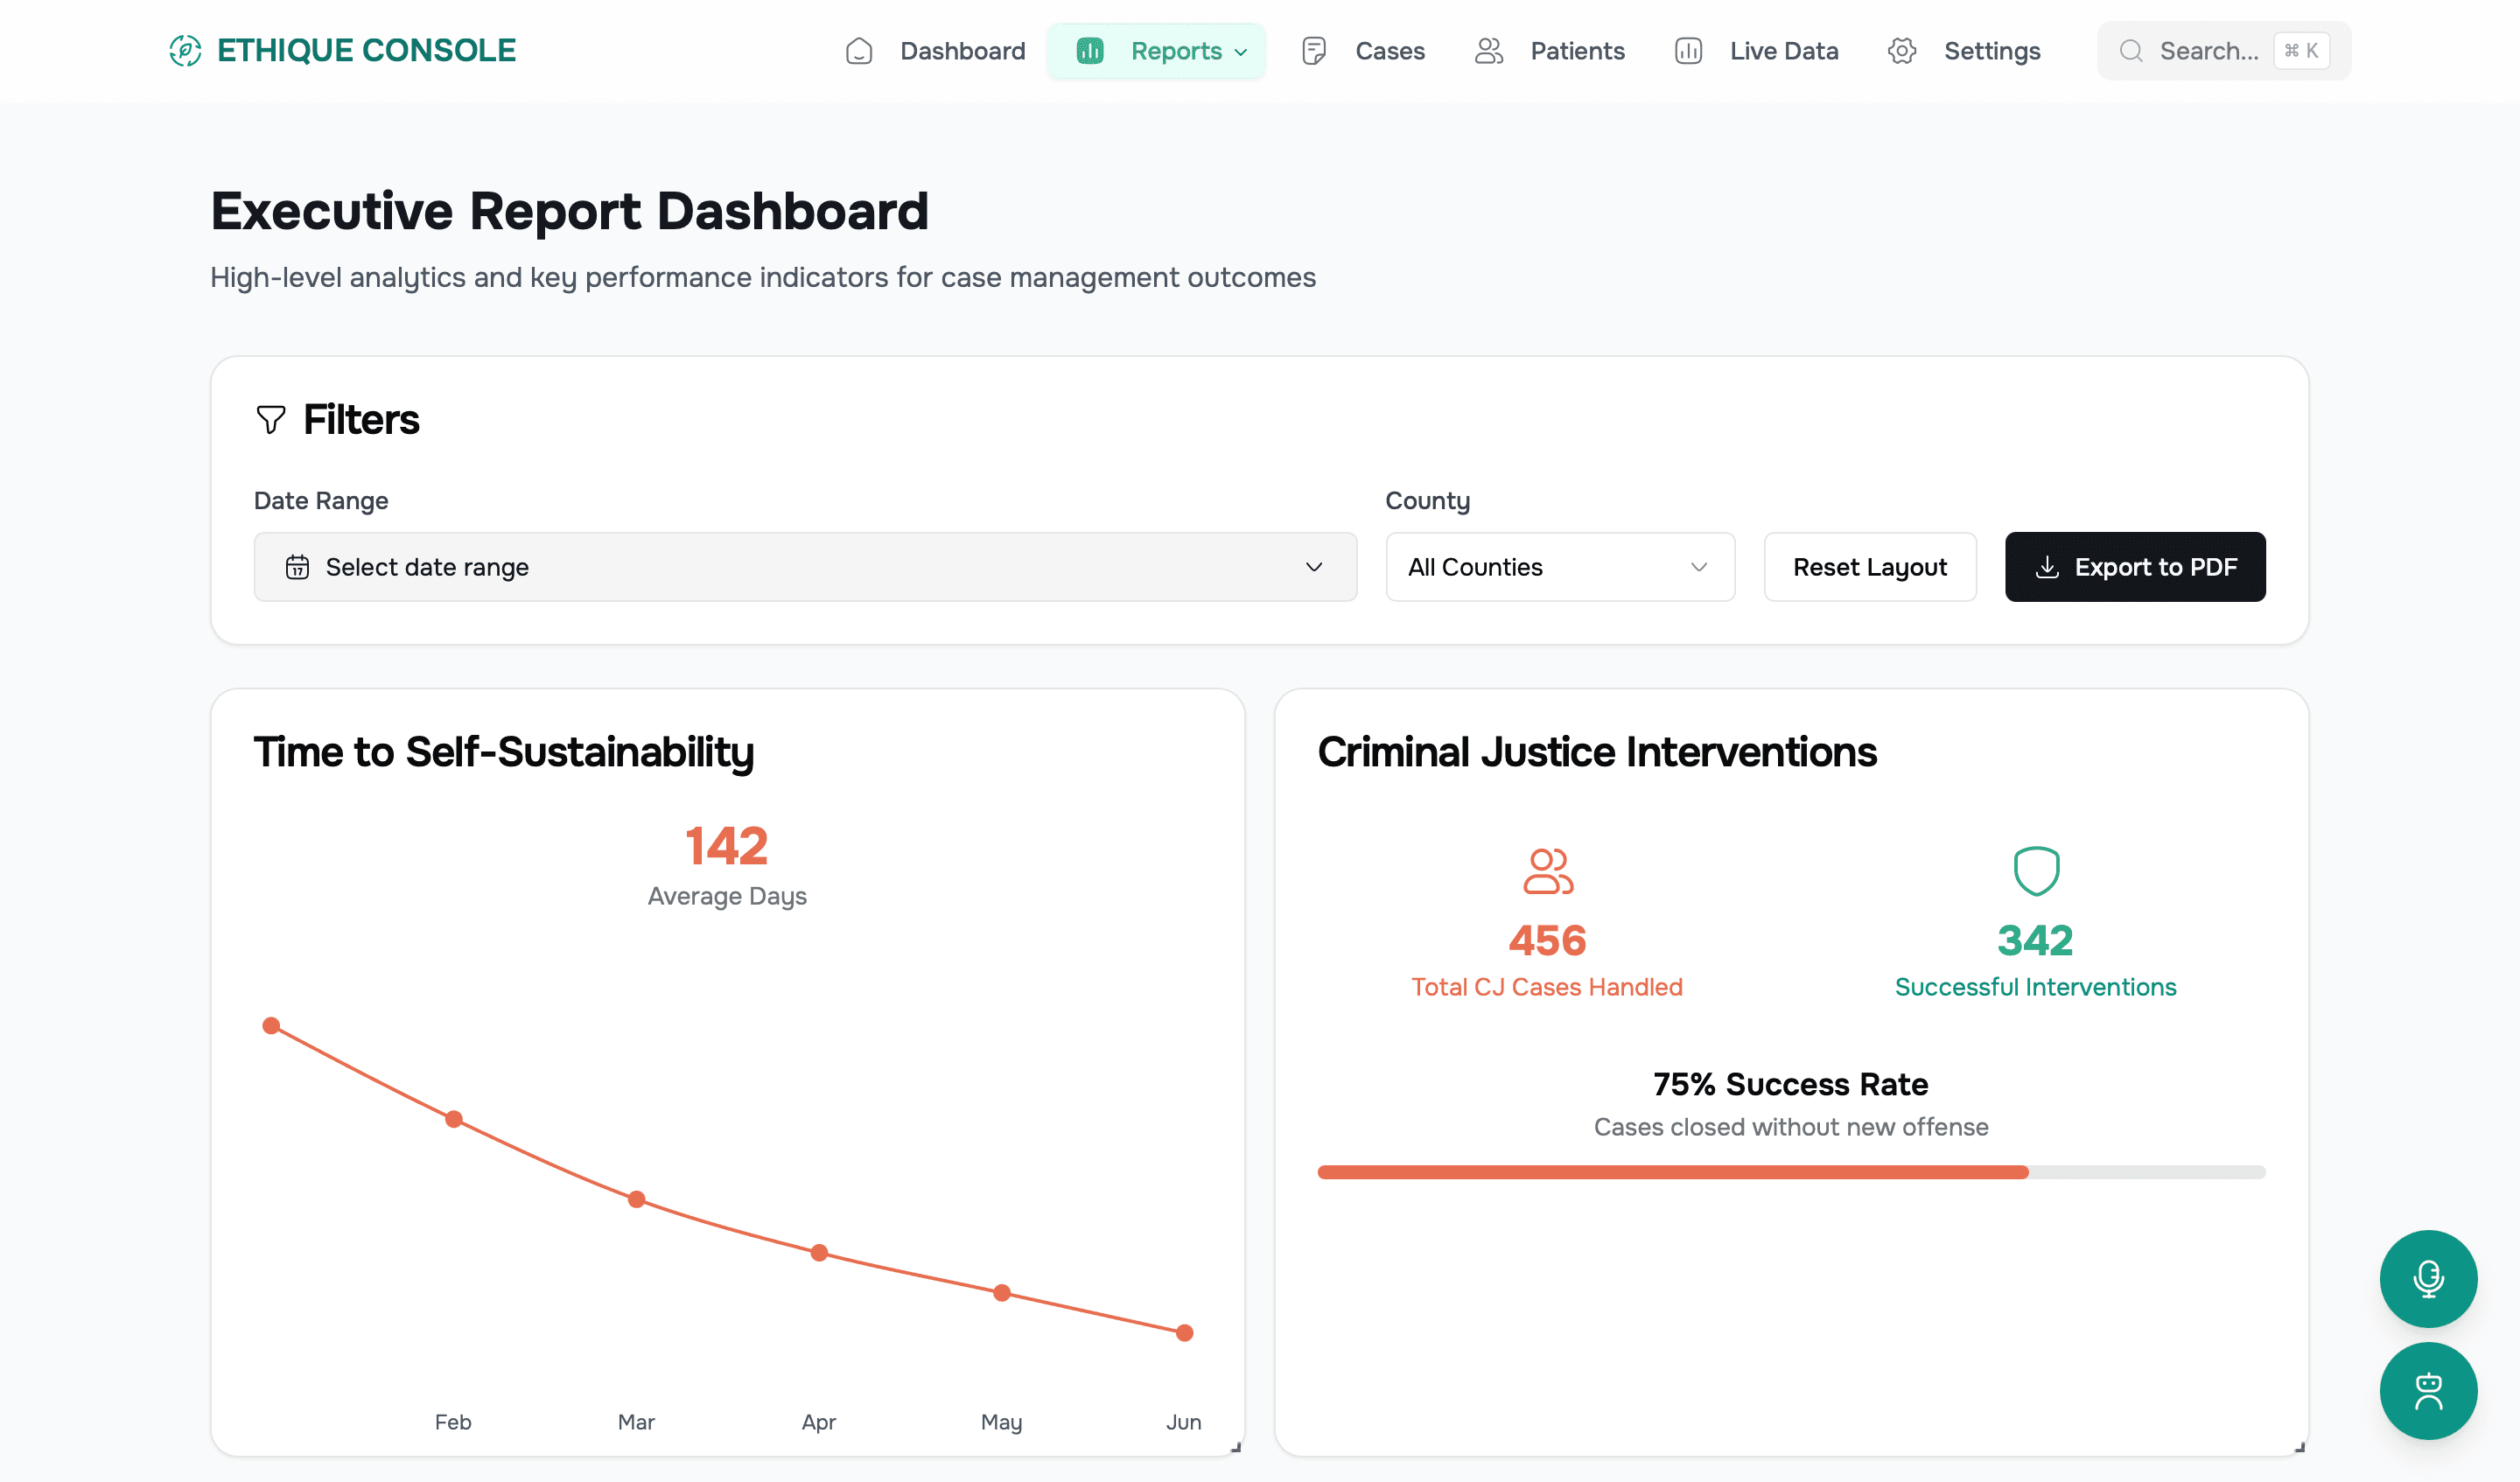
Measure Employment & Justice Outcomes
Track employment placement success and criminal justice intervention effectiveness. Show stakeholders how your programs reduce recidivism and help clients achieve economic self-sufficiency.
Employment Rate
58%
Employed
28% actively seeking employment
CJ Intervention Success Rate
78%
No Re-offense
234 total cases handled
Average Time to Self-Sustainability
142
Days
14% improvement over 6 months
Map Your Geographic Impact in Real-Time
Visualize case distribution and severity across counties. Identify high-need areas, allocate resources effectively, and demonstrate your reach to funders with interactive geographic data.
0-150 Cases
Manageable caseload with adequate resources and stable housing placement rates
151-250 Cases
Moderate demand requiring focused resource allocation and intervention planning
251+ Cases
High-need areas requiring urgent attention, additional staffing, and immediate intervention
Interactive County Severity Map
Click on any county to see detailed case breakdown by issue type
Hover over any county for details
Total Cases
1,247
Avg Days to Stability
156
Coverage Area
9 Counties
Your Data, Your Story. Build Custom Reports with Ease.
Combine any data sources, customize any metric, export anywhere all from one intuitive interface.
Components
KPI Card
Metrics
Bar Chart
Charts
Line Graph
Charts
Pie Chart
Charts
Text Block
Content
Image
Content
Data Table
Tables
Total Clients
1,247
+23%
Avg Resolution
12 days
-31%
Satisfaction
94%
+5%
Demographics by Age
Client Status